


Since 2020, we have partnered with the international sustainability consultancy ERM to assess our carbon footprint using the GHG Protocol. Thanks to Tikehau our shareholder.
In 2022, we launched an emissions reduction program, and in late 2023 we committed to SBTi to set science-based targets to reduce our emissions on all three Scopes.
In 2025, we set our decarbonisation targets for 2035 and 2050, with a Net Zero target for 2050. [See section “Transition Plan”]


Purchased goods & services

Capital goods (included in purchased goods and services)

Fuel – and energy – related activities

Upstream transport

Waste

Business travel

Employee commuting

Upstream leased assets [NA]


Fuel and gas consumption (sites, offices and vehicles)

Energy supplied (sites, offices and vehicles)


Downstream transports [NA]

Processing sold products [NA]

Use of sold products [NA]

Sold products end-of-life

Downstream leased assets [NA]

Franchises [NA]

Investments [NA]

Metropolitan France, Guadeloupe, Réunion, Martinique, French Guiana, Spain, Austria, Portugal, Ireland, Egypt, Jordan, Thailand, China, India
| Category | 2024 (tCO2e) | 2025 (tCO2e) |
|---|---|---|
| Scope 1 | 430 | 1190 (381+809) |
| Scope 2 | 751 | 344 |
| Scope 3 | 198,272 | 71,887 |
|
Scope 3 intensity: tCO2e per MWh produced for the year (SBTi indicator) |
0.412041471 | 0.121513474 |
| Total (Amarenco total) | 199,453 | 72,612 |
Why is there a decrease in our emissions compared with 2024?
It is proportional to the change in installed capacity. In other words, the majority of the decrease in our emissions is due to fewer projects becoming operational in 2025 compared with 2024. Same for Scope 3 intensity in tCO2e/kWh. This indicator will be more representative in the years to come as installed capacity stabilises annually. As our Transition plan has not yet been fully rolled out, the decarbonisation actions for our activities are not yet fully observable from one year to the next. See you in 2035!
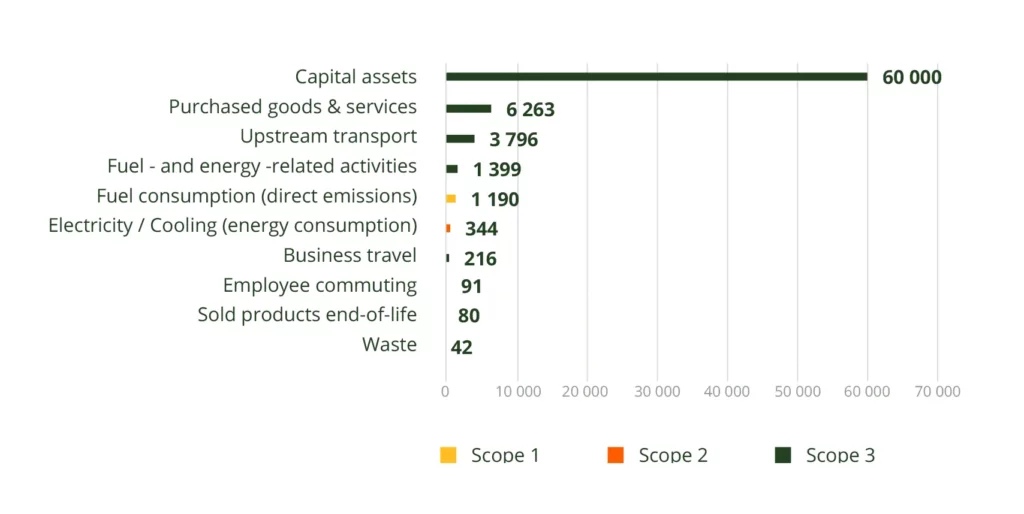
The footprint of our offices, including energy consumption and the purchase of services, represents 6,5% of our total carbon footprint in 2025.
This item includes:
– Purchases of goods and services
– Company fleet travel
– Business travel
– Home-to-work travel
– Office energy consumption (including heating, lighting)
– Office waste
For the first time in 2025, and to closely follow developments in the GHG Protocol, we have estimated the emissions due to land use change on the sites where we built our solar plants, across the entire portfolio of sites currently operated by Amarenco. The calculation was carried out by an expert firm using average data
This indicator measures the capacity of the soil and vegetation cover to store or release CO2, before and after the installation of the power plant. To do this, we compare the original land use with the site’s land use after construction of the power plant. We also take into account the rate of land artificialisation, whose average varies depending on the type of power plant.
For simplicity, the more degraded the final land type is compared with the original state, the more CO2e emissions we account for. This impact is reduced to the extent that we avoid building projects on areas of high environmental value, as set out in our ESG project criteria [See section ‘ESG Project Criteria’].
(all plants in operation in 2025 owned by Amarenco, based on actual electricity production in 2025)
| Year | Net emissions avoided during the year by all our plants in operation, in tCO2e | Cumulative emissions avoided year on year, in tCO2e |
|---|---|---|
| 2021 | 26,963 | 26,963 |
| 2022 | 33,716 | 60,679 |
| 2023 | 61,682 | 122,361 |
| 2024 | 64,838 | 197,268 |
| 2025 | 69,009 | 266,277 |
Thanks to the growing demand for new PV installations, this number is increasing every year. Thanks to the increase in our installed capacity, we produce more low-carbon solar electricity each year, and therefore avoid more GHG emissions.
As of 2022, our assessment of avoided emissions was based on the principles proposed by the Net Zero Initiative (June 2022) and the World Business Council for Sustainable Development (March 2023), while taking into account potential limitations in terms of data availability.
Avoided emissions usually refer to the equivalent emissions of the national electricity mix, for the same quantity of electricity (MWh) produced. Amarenco evaluates avoided emissions by estimating the difference between lifecycle carbon intensity of electricity produced by Amarenco PV plants and lifecycle carbon intensity of electricity produced by the average electricity mix in the countries where Amarenco’s PV plants are located.
The net avoided emissions provide a transparent view on the GHG emissions really avoided, and a better understanding to our PPA clients and offtakers of the carbon avoided in the Scopes 2 and 3 of their GHG footprint.
=
Emissions of the national energy mix
(or avoided emissions)
–
emissions of Amarenco plants